Quickstart
This page walks you through the example application to get you started. It assumes you already have OKCompute installed. If you do not, head over to the Installation section.
The included example application “example/example_app.py” gives a command line interface for testing the basic okcompute functionality:
usage:
example_app.py [-h] [--in1 IN1] [--in2 IN2]
                    [--fail-nodes FAIL_NODES [FAIL_NODES ...]]
                    [--specify-outputs SPECIFY_OUTPUTS [SPECIFY_OUTPUTS ...]]
                    [--specify-internal SPECIFY_INTERNAL [SPECIFY_INTERNAL ...]]
                    [--save-graph SAVE_GRAPH]

Run example_app

optional arguments:
-h, --help            show this help message and exit
--in1 IN1             value for in1. Missing if not specified
--in2 IN2             value for in2. Missing if not specified
--fail-nodes FAIL_NODES [FAIL_NODES ...]
                        induce failures in the specified nodes (node1-4)
--specify-outputs SPECIFY_OUTPUTS [SPECIFY_OUTPUTS ...]
                        Only run analysis for specified outputs (out1-3)
--specify-internal SPECIFY_INTERNAL [SPECIFY_INTERNAL ...]
                        Skip analysis by specifying intermediate values
                        (int1-2)
--save-graph SAVE_GRAPH
                        path to save graph of analysis
Overview
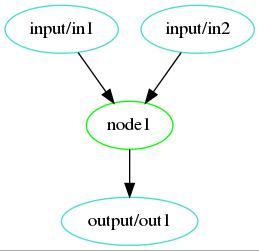
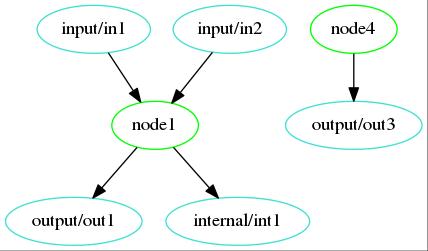
This example passes strings between analysis stages and prints the results along with a report on what processing occured. The graph of the analysis is:
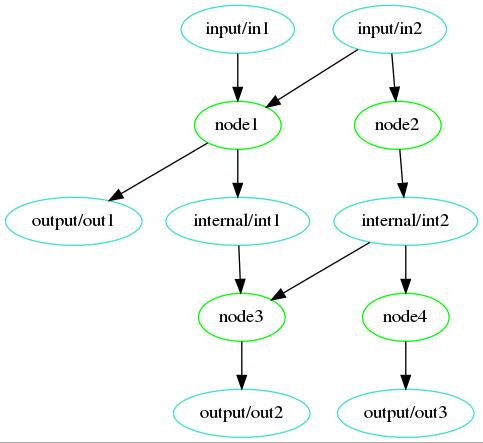
This was generated with the –save-graph arguement and the command
python example/example_app.py --in1 in1 --in2 in2 --save-graph test.png
Note that you need the optional PyGraphviz dependancy to generate plots.
You need to specify the input values since leaving them out would result in only a subset of the analysis being able to run.
Application
"""OKCompute Example Aplication

Provides command line interface to demenstrate basic framework usage
"""
Fields
import argparse
import json

from okcompute import Field, App

#: The okcompute app object. This is the handle for running analysis
example_app = App(name='example_app',
                  description='an example okcompute application',
                  version='1.0')

#: Fields used to reference data for analysis. The first parameter is the key.
# This key is a hierarchal path to a dict like object passed into the app to
# track state. The specific names (input/internal/output) are not special, and
# are just used here for clarity.

#: Input Fields. These map to data passed into the analysis
FIELD_IN1 = Field(key=['input', 'in1'],
                  description='dummy input 1')
FIELD_IN2 = Field(['input', 'in2'], 'dummy input 2')

#: Fields used to store intermediary values. These are values produced by
Nodes
The nodes are functions with the @example_app.metric decorator. This decorator specifies the input and output fields for the metric. This along with the parameters the function takes, specify it’s properties in the analysis set.
Each of these nodes adds some text to their input strings to trace the analysis.
They check the nodes_to_fail variable in the module and will raise an exception if their function name is in the list.
For example:
-
example_app.node1(in1, in2='default1')[source]¶ Example analysis node
This node needs FIELD_IN1 to run and FIELD_IN2 is optional It will generate output for FIELD_OUT1 and FIELD_INT1
and
Running Analysis
Based on the command line arguements a data_map is constructed. This is passed into the run function of the example application:
            'out3': FIELD_OUT3,
        }
        for val in args.specify_outputs:
            desired_output_fields.append(output_mapping[val])
The report is a description of what analysis was performed.
This report along with the contents of the data_map are then printed as json
Examples
Example1
python example/example_app.py --in2 in2 --save-graph test.png
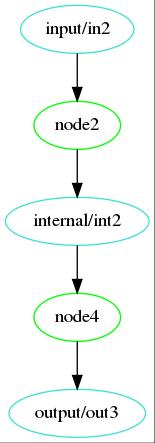
Report:
{
    "existing_results_skipped": [],
    "meta_data": {
        "app_meta": {
            "app_name": "example_app",
            "app_version": "1.0"
        },
        "elapsed": 0.0005397938657552004,
        "meta_args": "",
        "okcompute_ver": "1.0.0",
        "run_time": "2018-08-23 17:59:33.872258"
    },
    "metrics_missing_input": {
        "node1": {
            "bad_field": "input/in1",
            "has_default": false,
            "reason": "Missing input"
        },
        "node3": {
            "bad_field": "input/in1",
            "has_default": false,
            "reason": "Missing input"
        }
    },
    "run_results": {
        "node2": {
            "elapsed": 4.013720899820328e-05,
            "result": "Success"
        },
        "node4": {
            "elapsed": 3.7007033824920654e-05,
            "result": "Success"
        }
    },
    "unneeded_metrics": []
}
data_map:
{
    "input": {
        "in2": "in2"
    },
    "internal": {
        "int2": "node2_1[in2]"
    },
    "output": {
        "out3": "node4_1[node2_1[in2]]"
    }
}
Example2
python example/example_app.py --in1 in1 --save-graph test.png
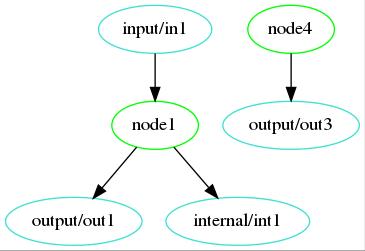
Report:
{
    "existing_results_skipped": [],
    "meta_data": {
        "app_meta": {
            "app_name": "example_app",
            "app_version": "1.0"
        },
        "elapsed": 0.0005211718380451202,
        "meta_args": "",
        "okcompute_ver": "1.0.0",
        "run_time": "2018-08-23 18:07:37.176488"
    },
    "metrics_missing_input": {
        "node2": {
            "bad_field": "input/in2",
            "has_default": false,
            "reason": "Missing input"
        },
        "node3": {
            "bad_field": "input/in2",
            "has_default": false,
            "reason": "Missing input"
        },
        "node4": {
            "bad_field": "input/in2",
            "has_default": true,
            "reason": "Missing input"
        }
    },
    "run_results": {
        "node1": {
            "elapsed": 4.7386856749653816e-05,
            "result": "Success"
        },
        "node4": {
            "elapsed": 1.2567033991217613e-05,
            "result": "Success"
        }
    },
    "unneeded_metrics": []
}
data_map:
{
    "input": {
        "in1": "in1"
    },
    "internal": {
        "int1": "node1_2[in1, default1]"
    },
    "output": {
        "out1": "node1_1[in1, default1]",
        "out3": "node4_1[fallback]"
    }
}
Example3
python example/example_app.py --in1 in1 --specify-internal int2 --save-graph test.png
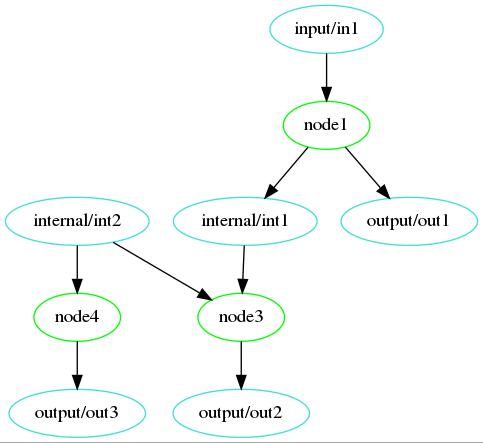
Report:
{
    "existing_results_skipped": [
        "node2"
    ],
    "meta_data": {
        "app_meta": {
            "app_name": "example_app",
            "app_version": "1.0"
        },
        "elapsed": 0.0006006751209497452,
        "meta_args": "",
        "okcompute_ver": "1.0.0",
        "run_time": "2018-08-23 18:10:28.268170"
    },
    "metrics_missing_input": {},
    "run_results": {
        "node1": {
            "elapsed": 4.170299507677555e-05,
            "result": "Success"
        },
        "node3": {
            "elapsed": 3.31320334225893e-05,
            "result": "Success"
        },
        "node4": {
            "elapsed": 4.4310931116342545e-05,
            "result": "Success"
        }
    },
    "unneeded_metrics": []
}
data_map:
{
    "input": {
        "in1": "in1"
    },
    "internal": {
        "int1": "node1_2[in1, default1]",
        "int2": "int2[Existing]"
    },
    "output": {
        "out1": "node1_1[in1, default1]",
        "out2": "node3_1[node1_2[in1, default1], int2[Existing]]",
        "out3": "node4_1[int2[Existing]]"
    }
}
Example4
python example/example_app.py --in1 in1 --in2 in2 --specify-outputs out1 --save-graph test.png
Report:
{
    "existing_results_skipped": [],
    "meta_data": {
        "app_meta": {
            "app_name": "example_app",
            "app_version": "1.0"
        },
        "elapsed": 0.000489966943860054,
        "meta_args": "",
        "okcompute_ver": "1.0.0",
        "run_time": "2018-08-23 18:16:39.424180"
    },
    "metrics_missing_input": {},
    "run_results": {
        "node1": {
            "elapsed": 4.816614091396332e-05,
            "result": "Success"
        }
    },
    "unneeded_metrics": [
        "node2",
        "node3",
        "node4"
    ]
}
data_map:
{
    "input": {
        "in1": "in1",
        "in2": "in2"
    },
    "internal": {
        "int1": "node1_2[in1, in2]"
    },
    "output": {
        "out1": "node1_1[in1, in2]"
    }
}
Example5
python example/example_app.py --in1 in1 --in2 in2 --fail-nodes node2 --save-graph test.png
Report:
{
    "existing_results_skipped": [],
    "meta_data": {
        "app_meta": {
            "app_name": "example_app",
            "app_version": "1.0"
        },
        "elapsed": 0.002555384999141097,
        "meta_args": "",
        "okcompute_ver": "1.0.0",
        "run_time": "2018-08-24 00:30:48.780909"
    },
    "metrics_missing_input": {
        "node3": {
            "bad_field": "internal/int2",
            "has_default": false,
            "reason": "Missing due to node2 failure"
        },
        "node4": {
            "bad_field": "internal/int2",
            "has_default": true,
            "reason": "Missing due to node2 failure"
        }
    },
    "run_results": {
        "node1": {
            "elapsed": 9.70639957813546e-05,
            "result": "Success"
        },
        "node2": {
            "elapsed": 0.0006355730001814663,
            "result": "Failure: Traceback (most recent call last):\n  File \"/home/axlan/src/okcompute/okcompute/okc.py\", line 331, in run\n    retvals = node.func(**kwargs)\n  File \"example/example_app.py\", line 75, in node2\n    raise AssertionError('Induced Failure')\nAssertionError: Induced Failure\n"
        },
        "node4": {
            "elapsed": 1.833500573411584e-05,
            "result": "Success"
        }
    },
    "unneeded_metrics": []
}
data_map:
{
    "input": {
        "in1": "in1",
        "in2": "in2"
    },
    "internal": {
        "int1": "node1_2[in1, in2]"
    },
    "output": {
        "out1": "node1_1[in1, in2]",
        "out3": "node4_1[fallback]"
    }
}